

Skip to content
The solution

The report shows the number.The target sets the direction.The measures move it.
01 · Report · Water use
20241,240 m³
20251,180 m³
−5% since 2024
02 · Set targets · 900 m³ by 2030
1.240
2024
1.180
2025
900
Target 2030
03 · Plan7 recommendations take you towards the target
—Check for leaks and drips—Water-saving aerators on taps—Reuse process water+ 4 more in the plan
01 · Report · Water use
20251,180 m³
20261,095 m³
−7% since 2025
02 · Set targets · 900 m³ by 2030
1.240
2024
1.180
2025
1.095
2026
900
Target 2030
03 · Plan7 recommendations take you towards the target
✓Check for leaks and drips✓Water-saving aerators on taps✓Reuse process water3 completed · 4 in the plan
Scroll to see more
01 — Starting point

Get ESG done — year after year

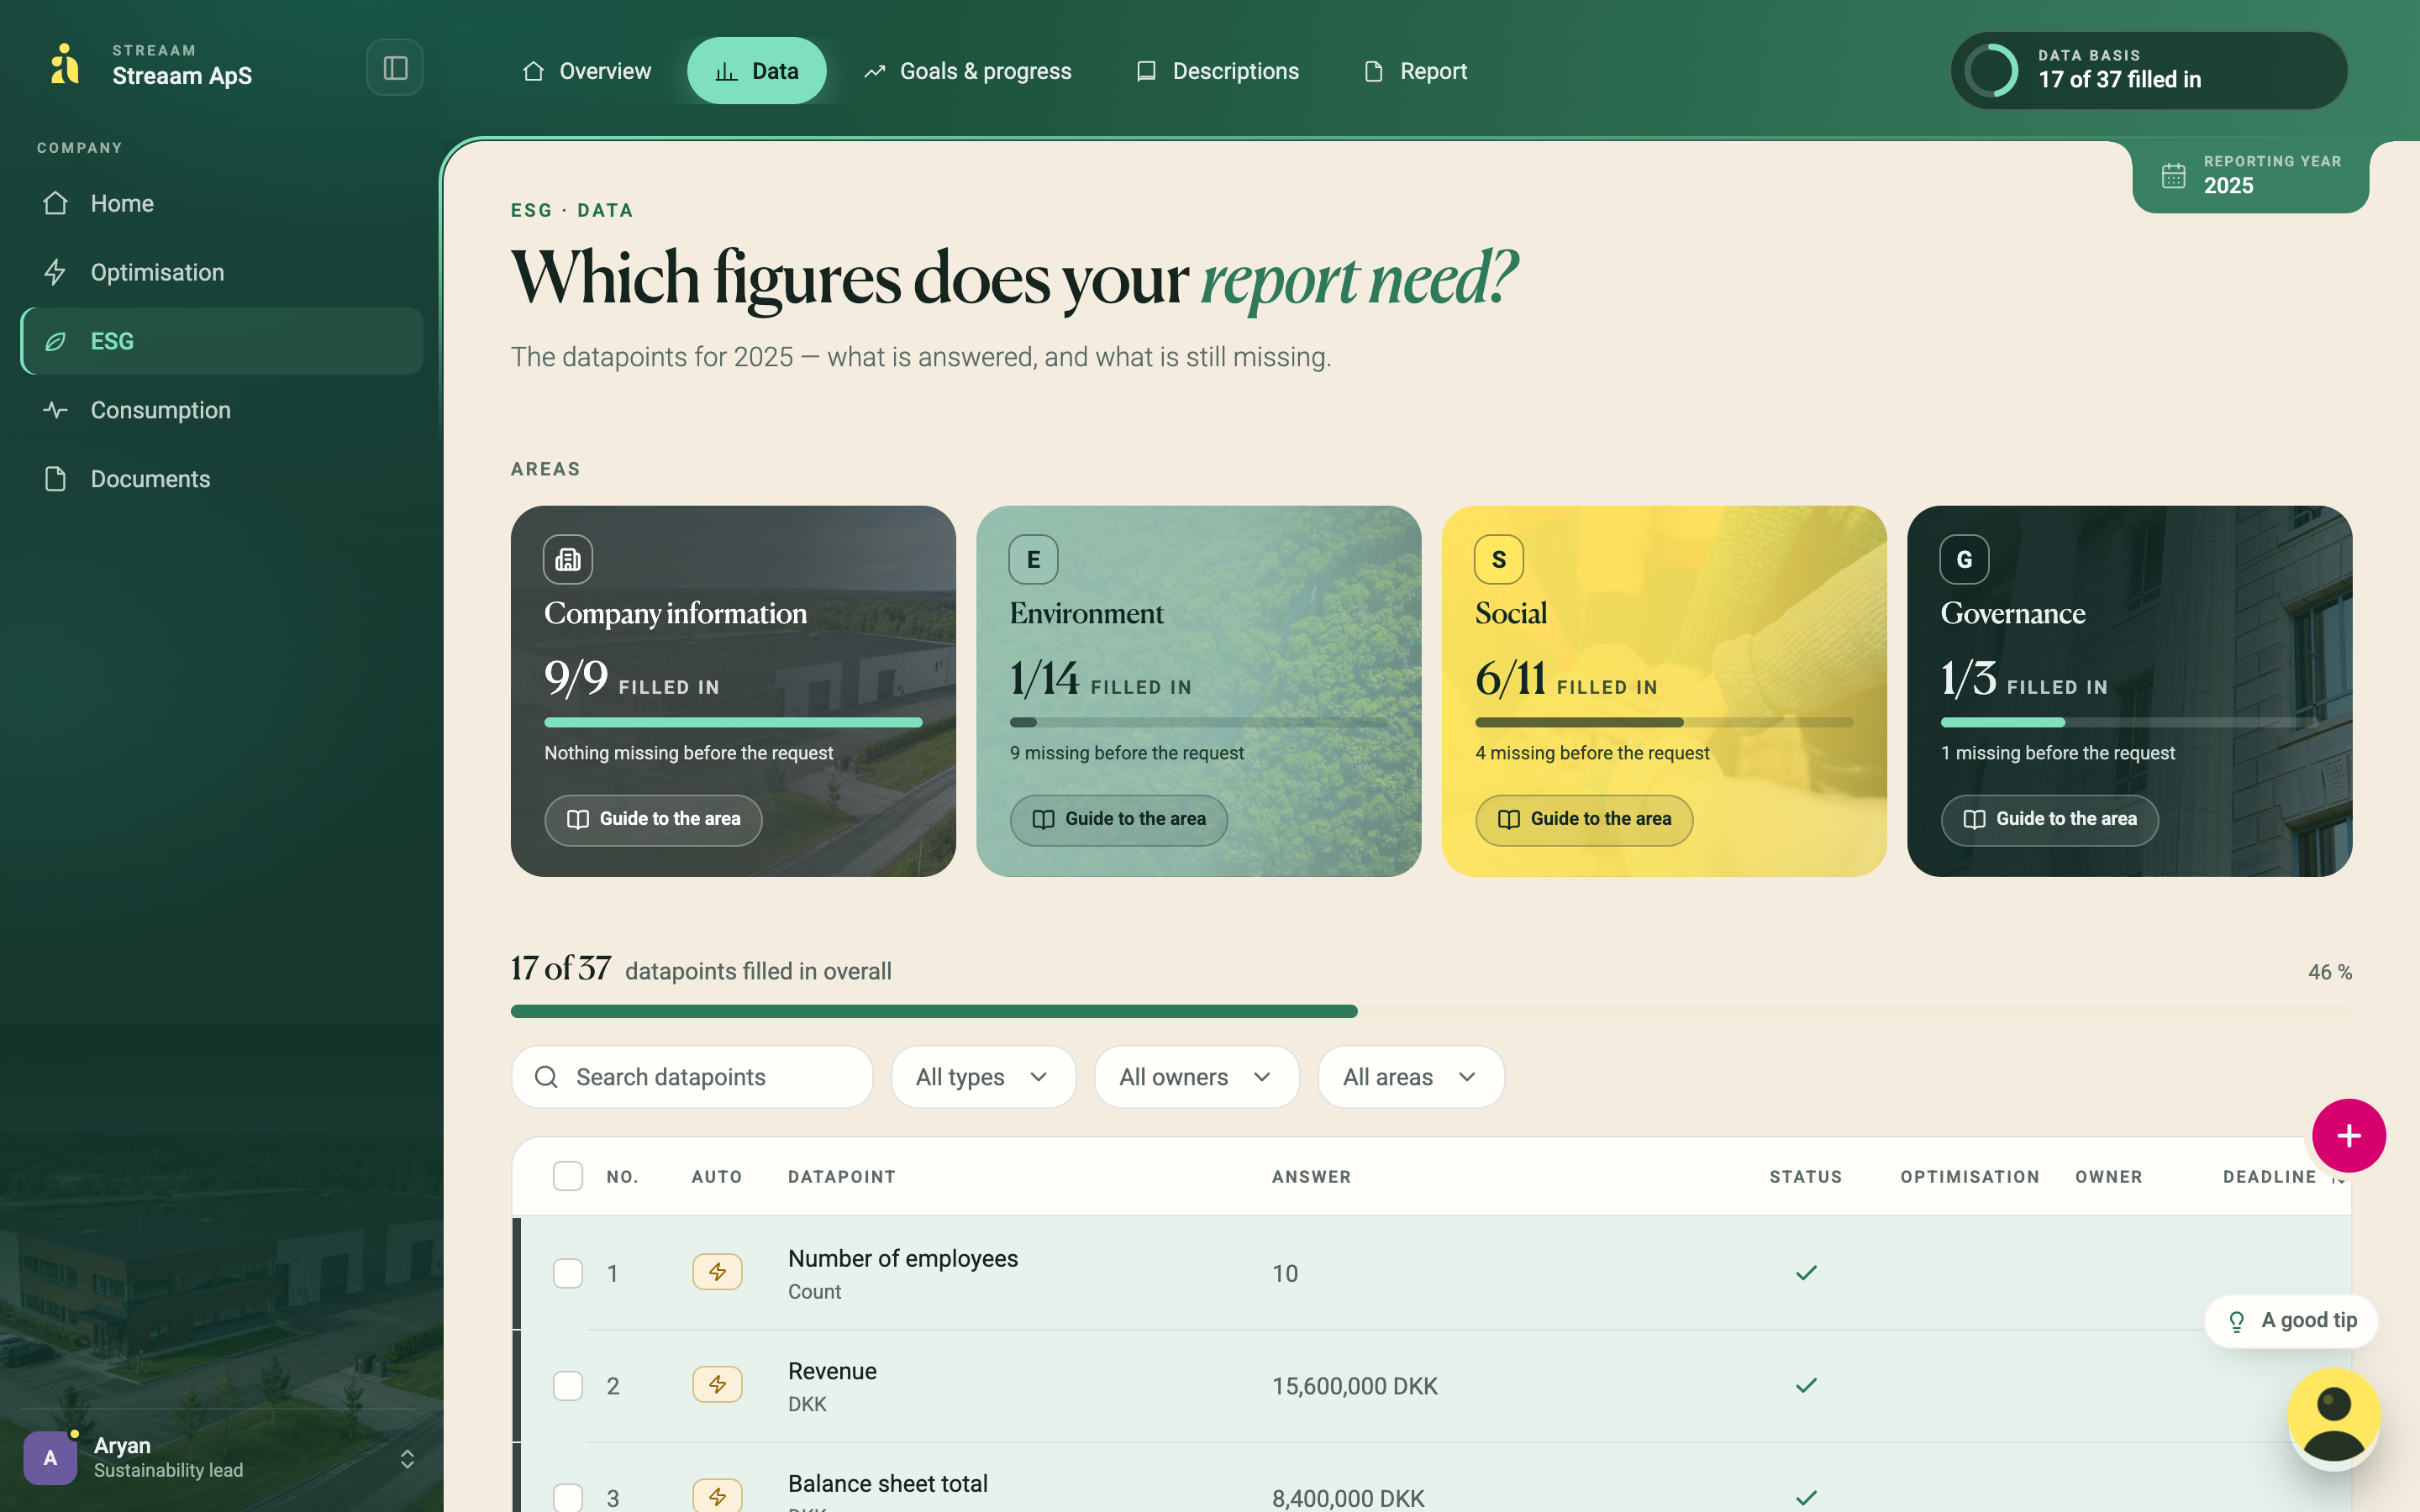
The report follows VSME — the EU's voluntary ESG standard for SMEs. You start with Basic: the data points that banks and large customers ask for, covering Environment, Social and Governance. A large share is filled in automatically from accounts and meters; Streaam guides you through the rest. And every data point shows the measures that can improve it.

—Start with VSME Basic — expand when you're ready
—Accounts and electricity use are fetched automatically
—Last year's figures are shown next to the current ones
40+data points in
VSME Basic
80+data points in the VSME
Comprehensive Module
Water use · Environment
20241,240 m³
20251,180 m³
−5% since 2024 · fetched from the meter
Target · Water use900 m³ by 2030
1.240
2024
1.180
2025
1.095
2026
900
Target 2030
Up to five priority targets — this is one of them
02 — Set targets

The report sets the baseline. You set the target.

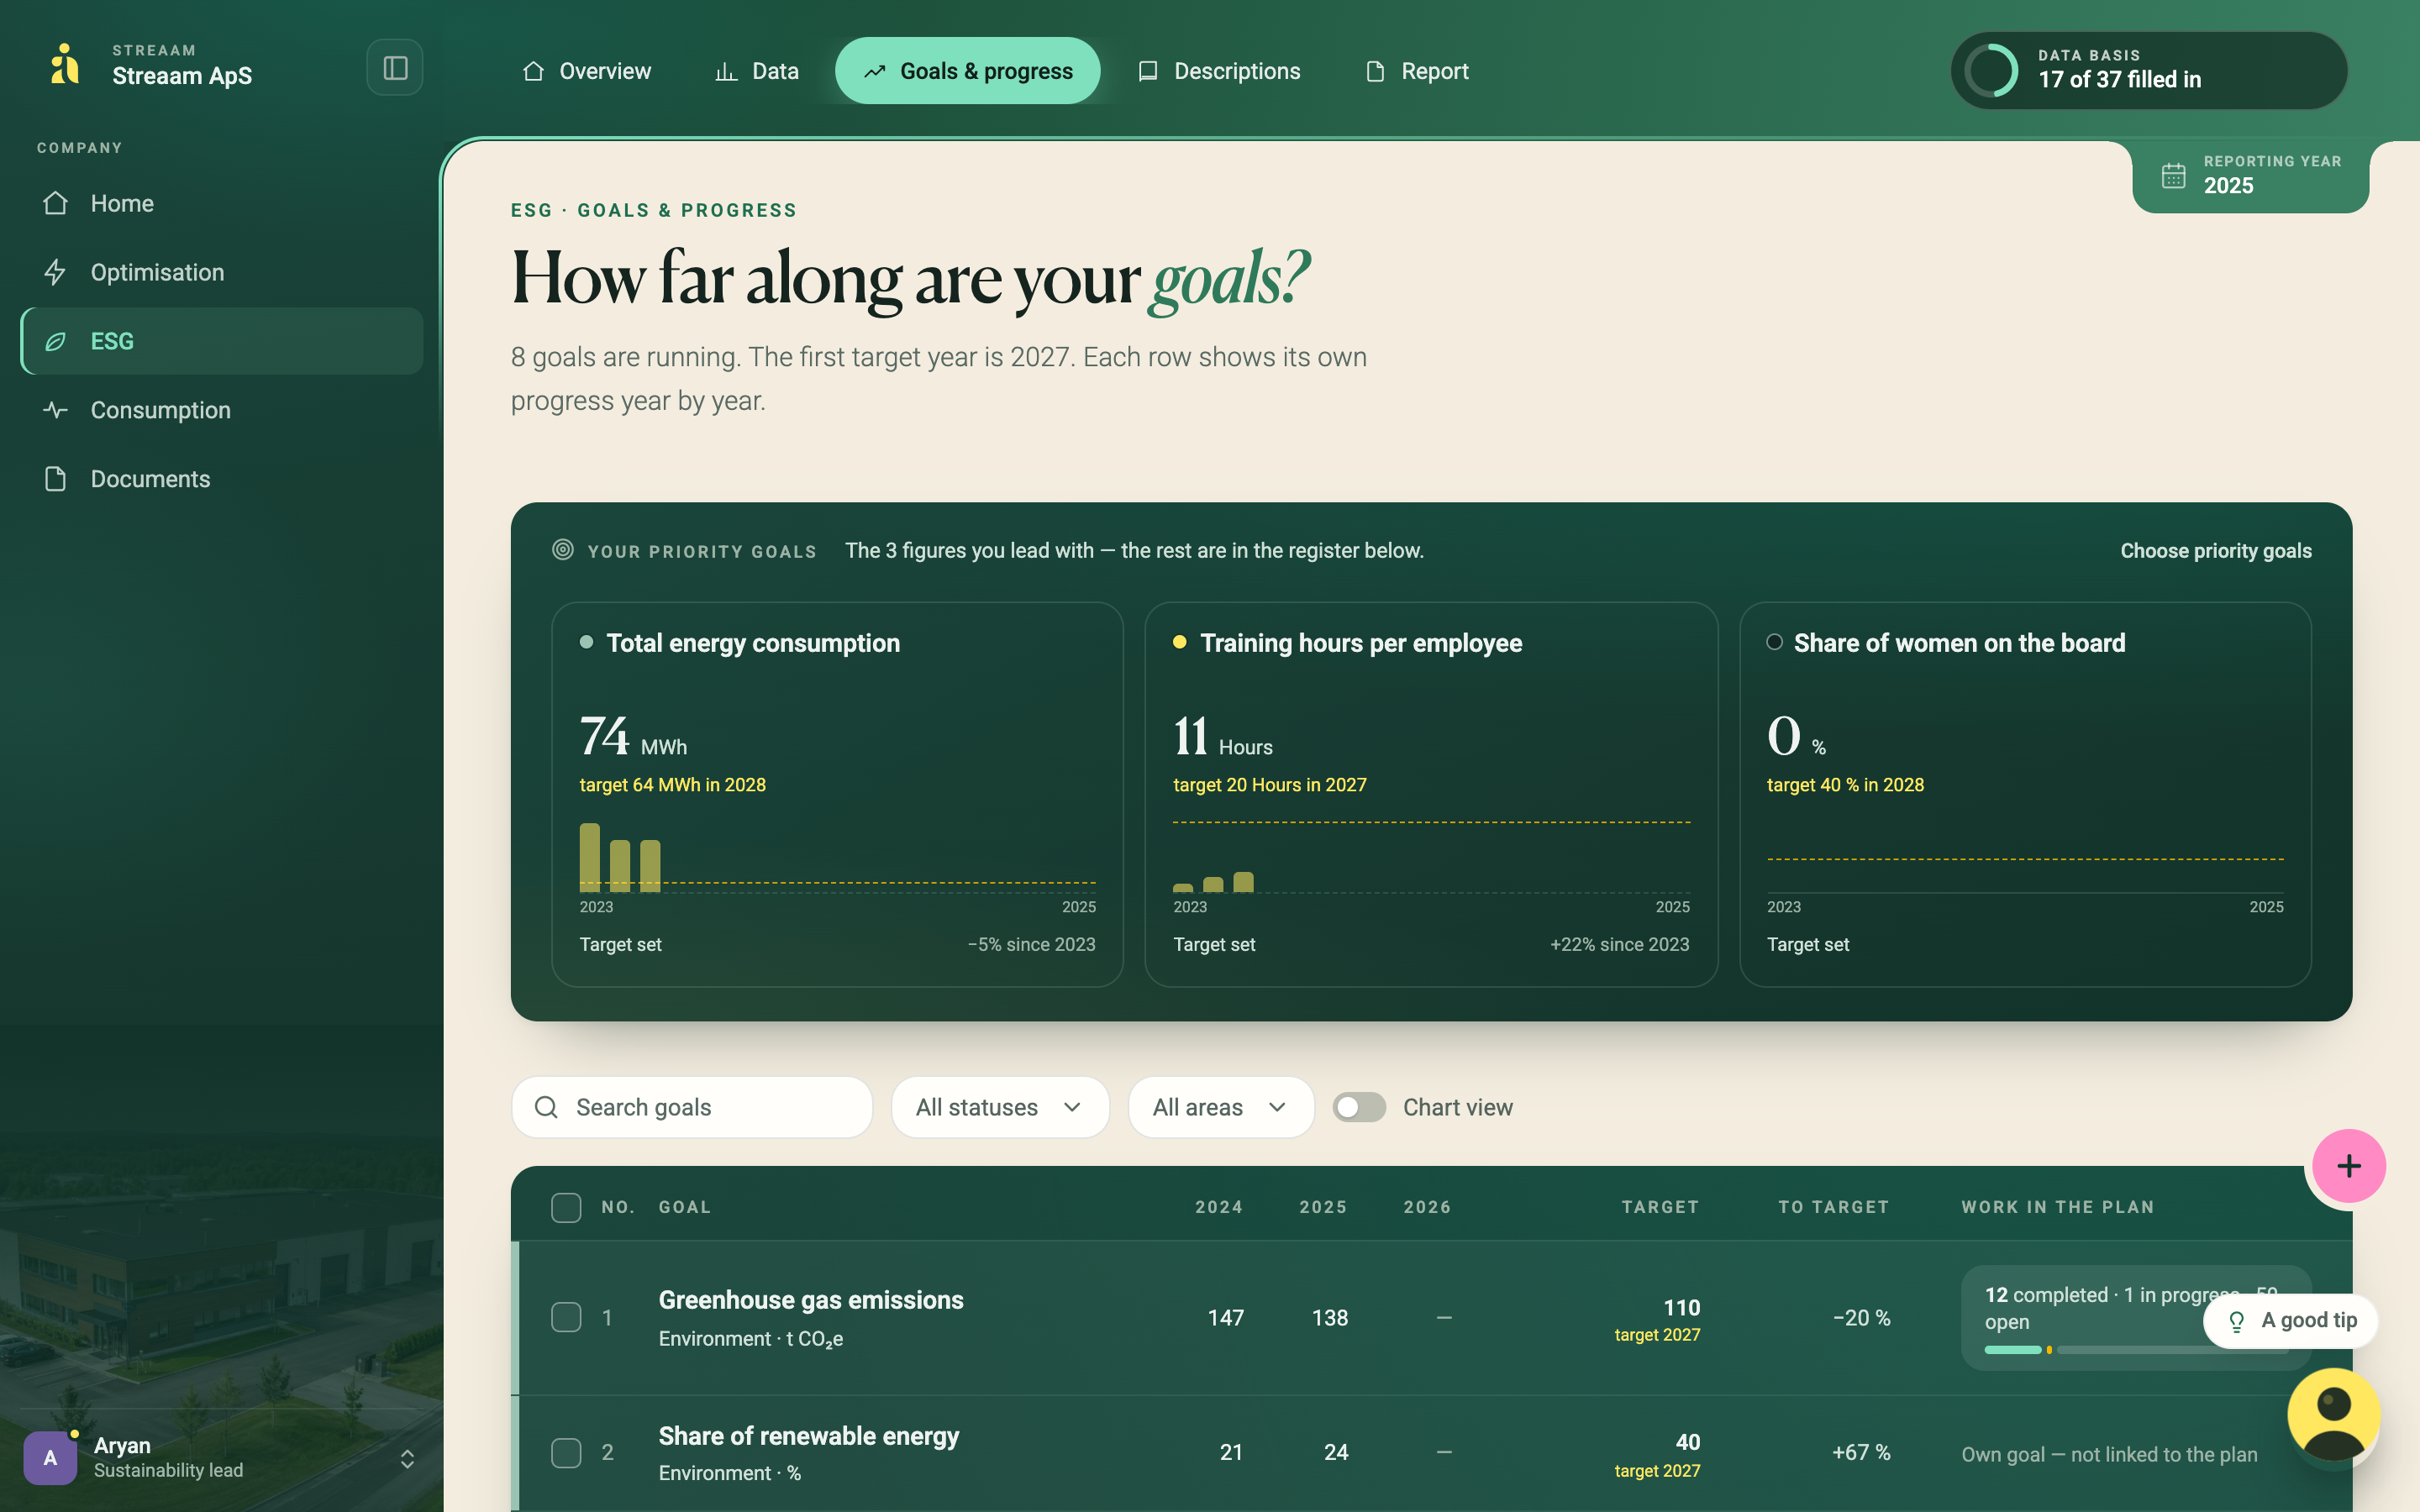
You choose up to five priority targets across Environment, Social and Governance. Year by year the new figure is added to the chart, and Streaam shows whether you're ahead or behind. For each target you can see the measures from the plan that help you reach it.

—Set targets for e.g. energy use, waste, training hours and pay gap
—“Behind plan · 39% of the way”
—Progress is frozen in each year's report
25+data points can have a target
5priority targets you lead with
03 — Plan and implement

Always get the next step

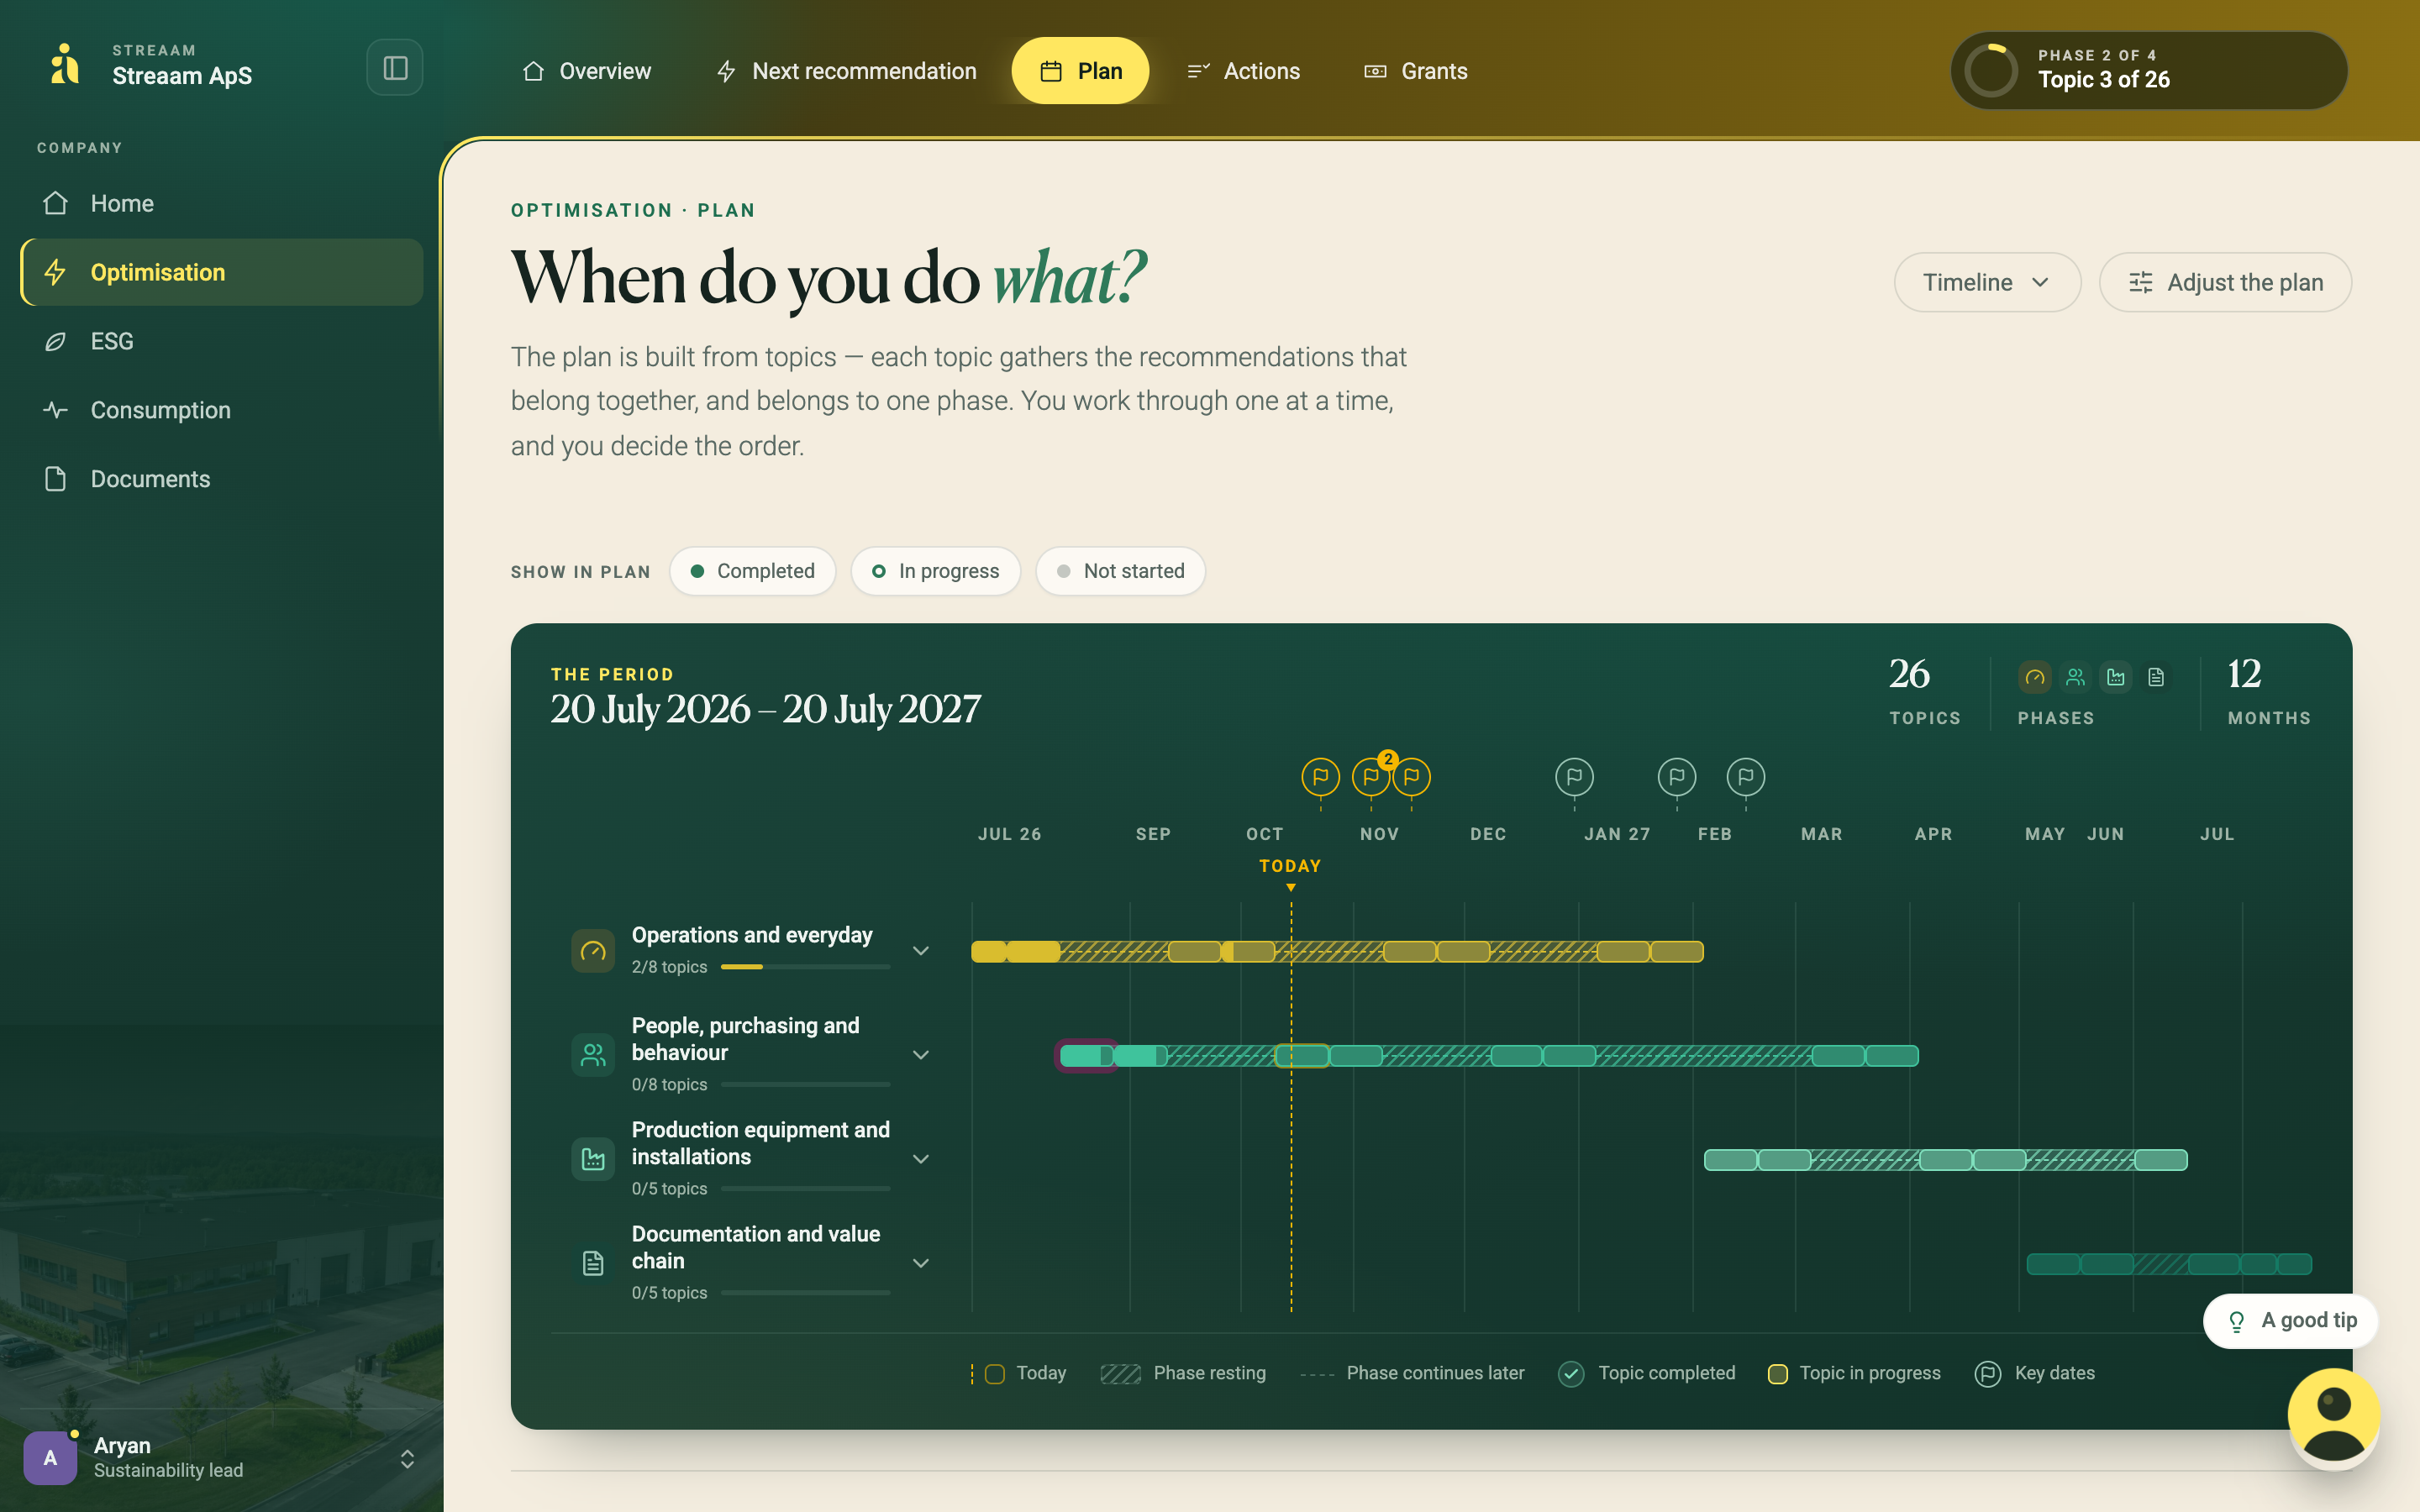
The plan is built from 250+ recommendations in four phases — from operations and daily routines, production equipment and behaviour to documentation and value chain. Each recommendation is scored on savings, external value, price and feasibility.
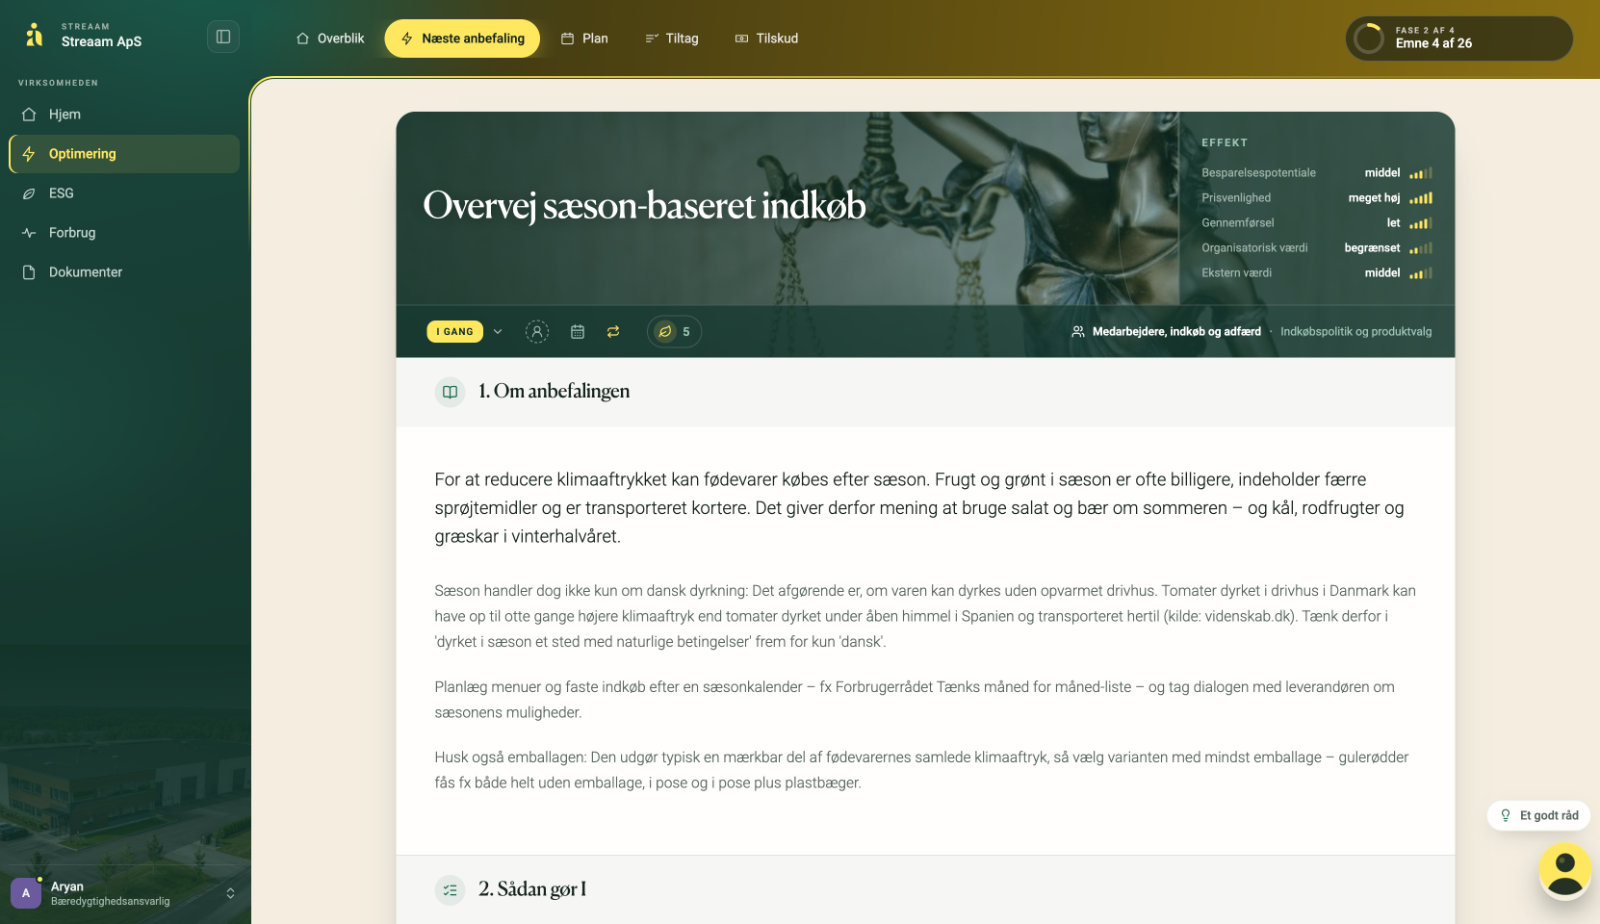
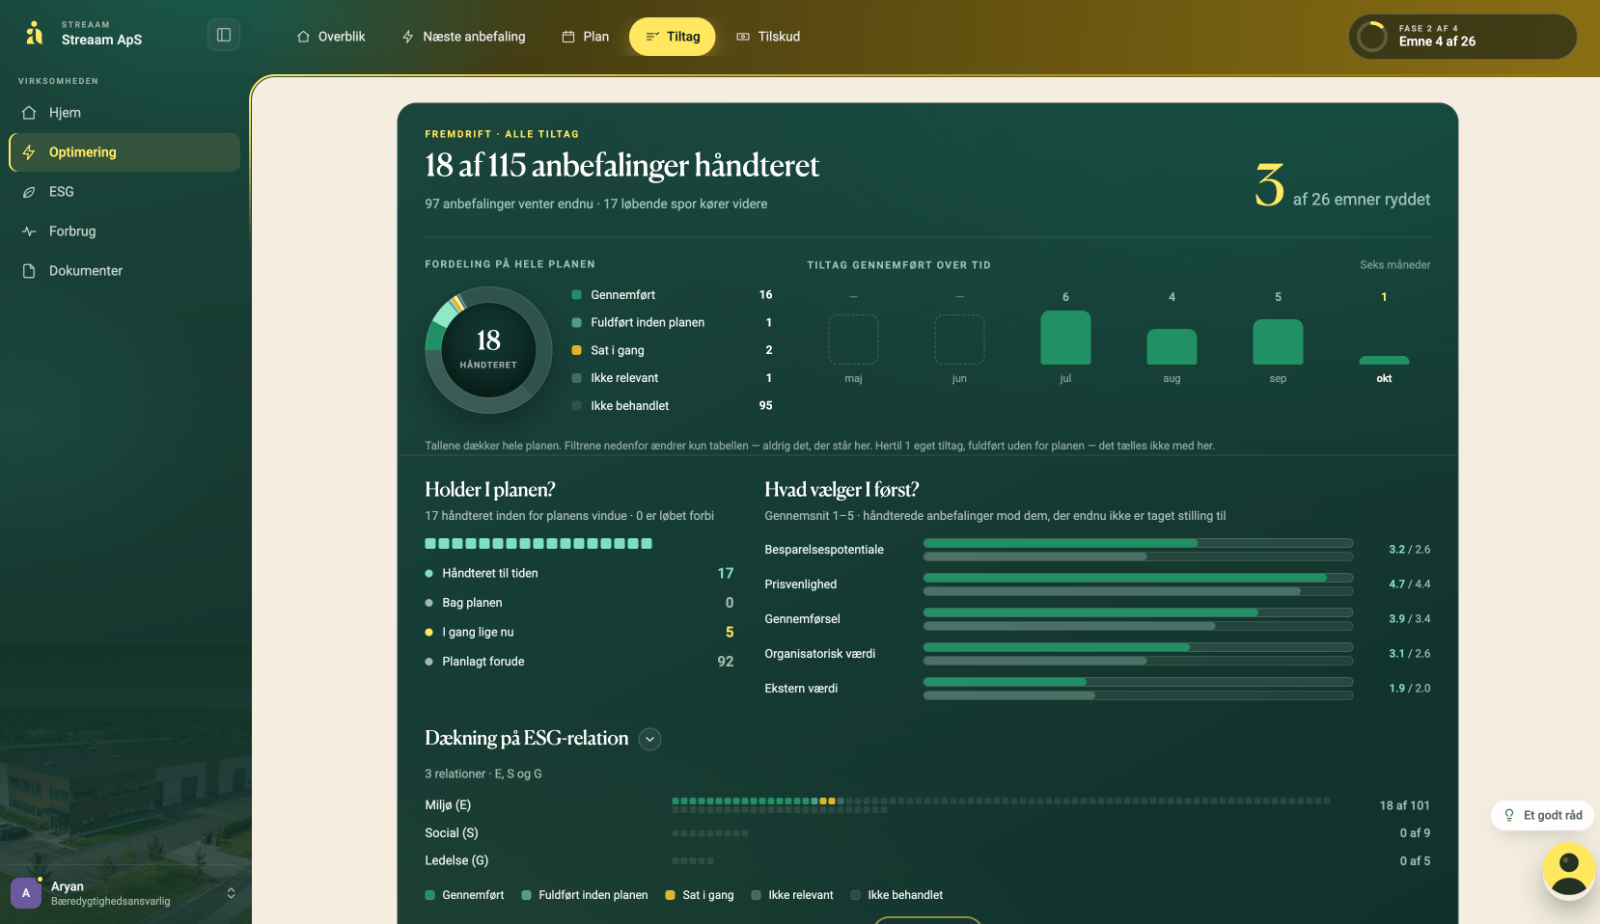
—Over half of the recommendations require no investment
—Grant schemes are automatically matched to the measures that need them
—Invite colleagues and build a team where each measure gets one owner and a deadline
250+recommendations
4phases
25topics
140+without investment
Who takes it — and when?
ARRLTJMKTP
Owner: AryanOwner: RasmusOwner: TrineOwner: MetteOwner: Thomas
In two weeks · 15 OctIn a month
Next reportCompleted measures countLast year's figures are shown alongside — so progress is visible
04 — Track progress

Track progress in your consumption and ESG

Once the mandatory points are answered, you submit a request and Streaam prepares the report in your colours, fonts and logo. The report is frozen in the history. From the second reporting year, last year's figures appear next to the current ones on every data point. The targets show whether you're ahead or behind, and completed measures are visible directly in the numbers. Then you set the next target and the journey continues.

—Electricity, water and heating fetched automatically from meters
—Delivered reports are frozen year by year for banks, customers and auditors
—Omissions are marked explicitly, so an empty field never looks like missing data
Example of the solution

See how one number develops

From first entry to second report — this is how ESG and optimisation work together in Streaam.

Water withdrawal · 2025
0m³
✓Revenue · e-conomic✓Electricity use · ElOverblik✓Scope 1 · calculated✓Geolocation · GIS
Environmental policy · draftStreaam AI
Streaam ApS will cut water withdrawal by 27% by 2030by prioritising the lowest-cost measures first —sealed installations, water-saving fittings and reuse of process water.The target is tracked annually in the ESG report; operations is responsible.
Target 2030 · 900
ESG report2025Streaam ApS
B6 · WaterPage 14
Water withdrawal
1.240m³ · 2025Target: 900 m³ by 2030
1.240
2025
900
Target 2030
B6.36Total water withdrawal1,240 m³
B6.37‑1Water withdrawal, production640 m³
B3.32‑1Total energy consumption74 MWh
B3.33bScope 2 emissions11.2 t CO₂e
Water withdrawal is based on meter readings for the entire site.The target is 900 m³ by 2030 (−24%), prioritised as one of five targets.The effort follows phases A–D of the plan and is reported annually.
ESG report2026Streaam ApS
B6 · WaterPage 14
Water withdrawal
1.095m³ · 2026−12% vs. 2025
1.240
2025
1.095
2026
900
Target 2030
B6.36Total water withdrawal1,095 m³
B6.37‑1Water withdrawal, production582 m³
B3.32‑1Total energy consumption69 MWh
B2.29aMeasures completed3 of 7
The drop is due to sealing installations, water-saving fittings andreuse of process water — all completed in phases A–B of the plan.We are 40% of the way to the 2030 target.
JulAugSepOctNovDecJanFebMarAprMayJun
A · Operations and daily routines
B · Production equipment
C · Employees and behaviour
D · Documentation
TODAY
RL
Check for leaks and dripsPhase A · deadline set
✓
TJ
Water-saving aerators on tapsPhase A · deadline set
✓
TP
Reuse process waterPhase B · deadline set
✓
RL
Meter per departmentPhase B · deadline set
✓
TJ
Cleaning routines using less waterPhase C · deadline set
✓
AR
Water withdrawal in the supply chain is documentedPhase D · deadline set
✓
01 — The starting pointWe find the number together.The solution integrates with multiple data sources. Even without an API, we guide you every step of the way.
02 — The wordsThe descriptions are written around your situation.Streaam AI drafts your environmental policy from figures, targets and priorities. You edit and approve.
03 — The targetYou set the direction.900 m³ by 2030. A number and a year on a data point from the report — one of up to five priority targets.
04 — Report, year 1The report is generated.Cover, data, targets and descriptions come together in your colours and fonts. The baseline is set — and the report is frozen in the history.
05 — The planGet the plan in place.Plan optimisation across four phases and 250+ recommendations. We point out which ones relate to your specific ESG data point.
06 — ActionImplement with your team.Delegate by responsibility and bring the initiatives to life in the organisation. Complete as many as you can.
07 — The number movesConsumption drops.1,240 → 1,095 m³. Every completed measure knows which data point it moves — and you can see it right away.
08 — Report, year 2Document the impact year on year.The 2026 report shows lower figures and describes the measures. Last year's figures sit alongside. The next target awaits.
Your choice

Choose how much you want to take on

The connection is strongest when ESG and optimisation work together. But each also stands well on its own — and you can always switch on the other later.

ESG onlyESG
Report and set targets

Steps 01, 02 and 04. VSME report, targets and year-on-year history — without plan and measures. The data points still show which measures could improve them.

Optimisation onlyOptimisation
Plan and save

Step 03. 250+ recommendations, a four-phase plan, grants and delegation — without an ESG report. The measures still show which data points they would move.

BothESGOptimisation
The full cycle

All four steps. The report sets the baseline and the direction. The measures move the numbers, and the next report shows the result.

Frequently asked questions

What most people ask

A 30-minute meeting and access to your meter and accounting data. Over half of the data points are filled in automatically or calculated — e.g. revenue, total assets and electricity use via ElOverblik.

No. You choose the level of ambition. You start with VSME Basic — the data points banks and large customers ask for. You can add the rest year by year.

You set the pace. The plan is split into four phases, and you work on one measure at a time with an owner and a deadline.

Yes. Delivered reports are frozen in the history, so you can show progress year by year.

30 minutes based on your situation

We show you what a VSME report requires of you and what a plan would look like. No obligation — or call +45 61 40 01 01.

We reply within one business day.